



Pit Wall splits platform and technique across two tabs. Both respect lap scope from Stint analysis.
When a stint or manual range is active, a banner at the top shows the scope with Clear filter. Use Overlay (same control as Strategy / Thermal) to compare a second stint or Custom lap range — muted dual values on Driver summary cards, stint-age–aligned compare rows in per-lap tables, side-by-side Ride Height histograms, muted Damper / Shift Discipline cards, and muted cards plus dashed stint-age lines on Chassis Aero Balance / Aero Efficiency. G-G peak/utilization and Aero Efficiency card aggregates are sampled inside the active scope (and overlay scope), not the full session. Vmax / shift check stays Base-scope only (Overlay does not apply to the distance preview).
Sections only appear when your recording includes the relevant channels. Empty Chassis copy distinguishes missing LMU channels from needing more flying laps (Aero Balance Shift needs at least two).
Chassis view
Open Pit Wall → Chassis tab (formerly labeled Car).
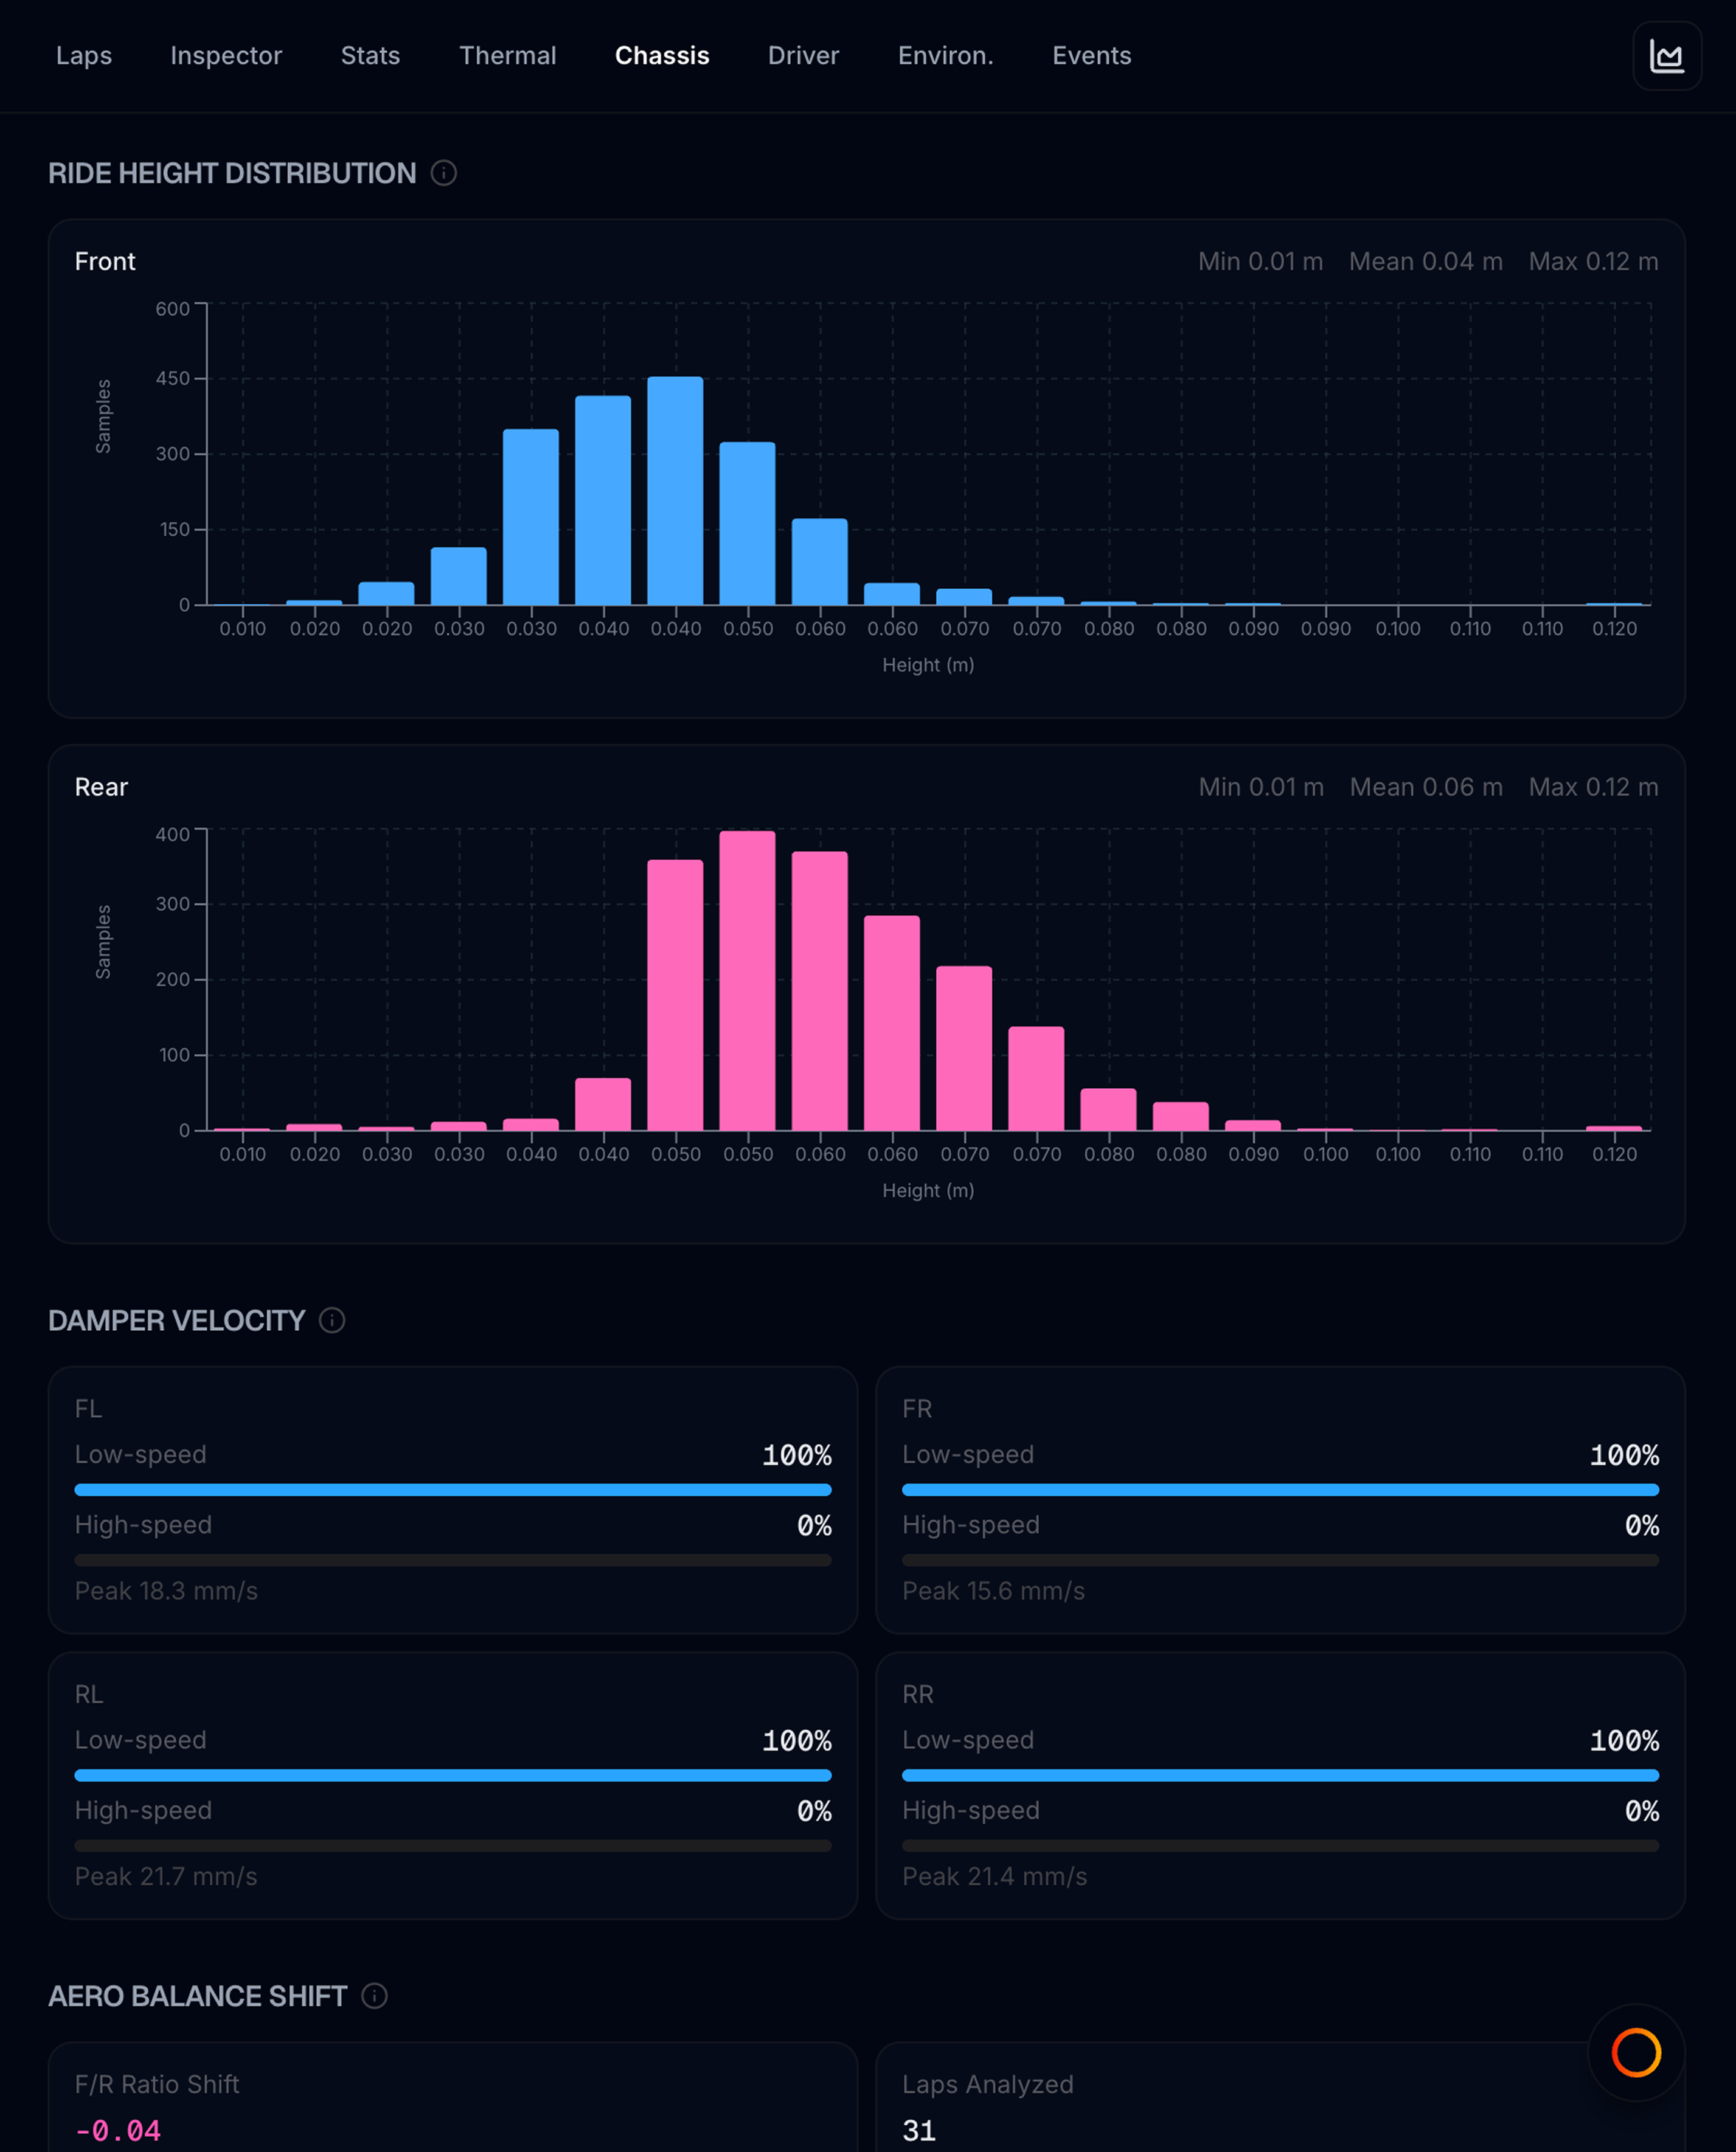
Chassis answers: How is the platform set up mechanically and aerodynamically?
While this tab is open, the track map colours the lap by ride height, with chips for Damper speed and Rake — the spatial companion to the histograms below, showing where on the circuit the platform is working. The coloured lap follows your Vmax preview lap, or the lap you hover in a lap-axis chart.
Ride Height Distribution
Histograms of front and rear ride height (mm) across samples in the active lap scope (and Overlay scope when set).
| Element | Meaning |
|---|---|
| Min / Mean / Max | Height range in millimetres (muted second row = overlay) |
| Histogram | How often the car sat at each height; side-by-side when Overlay is on |
| Amber warning | High share of samples near minimum — possible bottoming out |
| Open Suspension charts | Jumps to Inspector Suspension presets for FRH/RRH vs lap distance |
Overall height sits in the histogram. For location along the lap, the map’s Ride height colouring shows the low spots at a glance, and the Suspension charts give the exact trace.
Damper Velocity
Per corner, fraction of samples with damper shaft speed under vs over 25 mm/s (descriptive motion split — not a damper click recipe):
| Band | Typical cause |
|---|---|
| Low-speed share (<25 mm/s) | Pitch and roll — weight transfer, cornering |
| High-speed share | Kerbs, bumps, high-frequency track input |
| Peak velocity | Hardest single damper hit in scope |
A high low-speed share on a smooth circuit is common and should not be read as “remove high-speed damping.” With Overlay set, muted second values compare the overlay scope.
The map’s Damper speed chip colours the lap by the fastest shaft speed in each stretch, so you can see which kerbs and bumps produce the high-speed share.
Aero Balance Shift
Tracks front-to-rear ride height ratio and rake (rear − front, mm) at peak speed each lap as fuel burns off. Cards show F/R ratio shift and rake shift over the scope, with short labels for how the platform drifted. With Overlay set, dashed series align by stint lap age.
Aero Efficiency
Measured at high speed (above ~70% of scope V-Max): L/D ratio, front downforce share, and drag. Overlay adds muted card values (same scope sampling) and a dashed L/D line.
Vmax / shift check
Compact speed + longitudinal G vs distance preview on one flying lap (RPM shown muted when available), plus Open Vmax / shift charts for the full Inspector Vmax · Gearing stack (multi-lap compare, corner zoom). Preview is Base scope only — Overlay does not apply. After an upshift, a brief long-G dip is normal; focus on depth and recovery. Diagnosis only — not an automatic optimal shift-RPM calculator.
Driver view
Open Pit Wall → Driver tab.
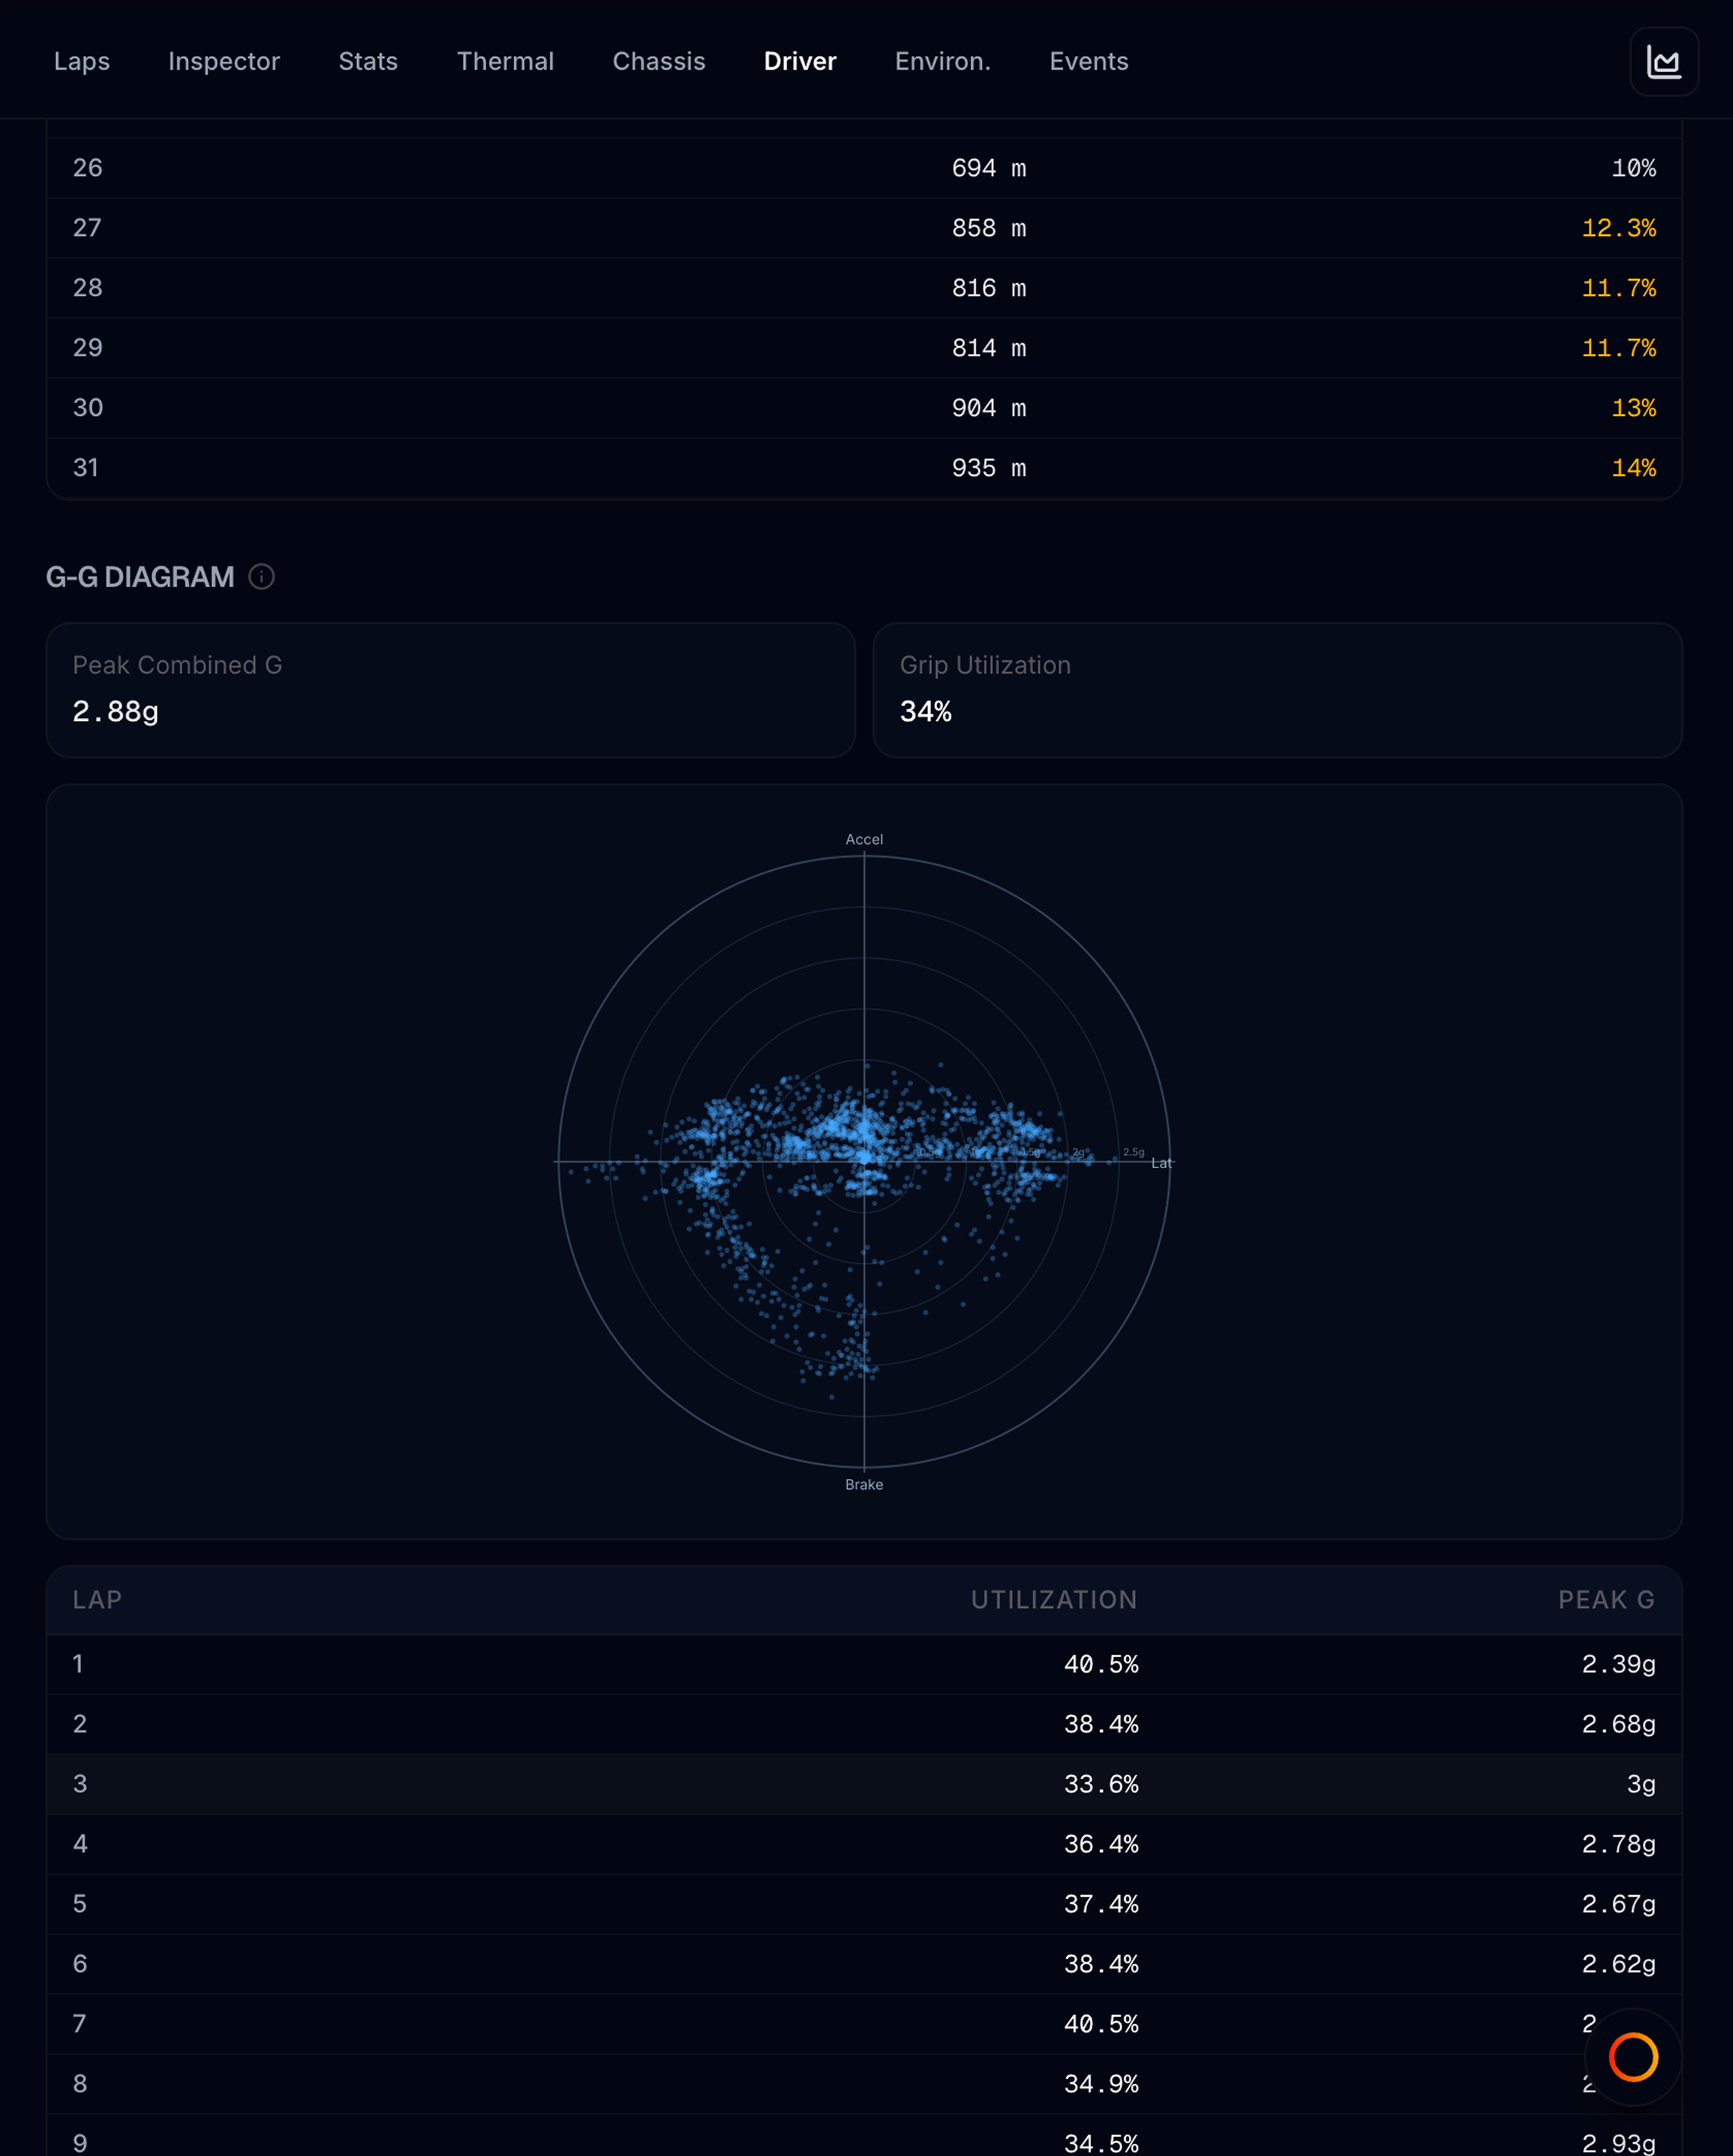
Driver answers: How am I using inputs and grip?
While this tab is open, the track map colours the lap by driver inputs — red where the brake is down, green on throttle, grey while coasting — so you can see where trail braking, coasting, and throttle application happen on the circuit. The legend under the map splits the lap by share (e.g. Brake 18% · Throttle 61% · Coast 21%), which is the spatial companion to the Coasting Distance card. The map treats a pedal as applied above 10% (the racing-line colour threshold); the Coasting chart below uses a stricter 1% definition, so the two coast figures are expected to differ. Hover any per-lap table row to rebuild the coloured line for that lap.
Trail Braking
Brake pressure still applied while lateral G builds on entry — overlap % per lap (green ≥40%, amber below 20%).
Shift Discipline
Share of upshifts in the power band (about 92–100% of max RPM), plus total shifts and average shift RPM — sampled in the active lap scope. With Overlay set, muted second values compare the overlay scope.
Coasting Distance
Metres (and % of lap) where both throttle and brake stay below 1% — amber when coasting exceeds ~10% of the lap.
G-G Diagram
Lateral vs longitudinal G scatter for the scoped laps: peak combined G, grip utilization %, and per-lap rows. Aggregates use the active scope (and Overlay scope when set).
Braking Performance · Throttle Application · Steering Smoothness
Heavy-brake zones (peak G, entry speed, modulation), exit throttle time-to-full / lifts / smoothness, and steering smoothness scores — with Overlay compare rows aligned by stint lap age where tables support it.
Oversteer / Understeer Balance
Compares lateral G to steering at similar speeds using a fit from this session (no yaw rate or car constants). Summary cards show average Oversteer, Understeer, and Grip; the table adds Neutral.
| Column (per lap) | Meaning |
|---|---|
| Oversteer % | Countersteer or rear wheelspin vs ground speed — evidence of a rear event |
| Understeer % | Less lateral G than the session fit for that steering / speed |
| Grip % | More lateral G than the session fit, without those oversteer events |
| Neutral % | Close to the session fit |
Oversteer % is stricter on purpose. Rear wheelspin catches power-on spin; mid-corner or lift-off rotation without wheelspin may only show as a brief Countersteer chip on the Track Map Balance overlay, not a large Oversteer % window.
Grip % means “above this session’s typical G for that steer,” not “better driving.” Line, tyre temp, downforce, and commitment all mix in — treat it as descriptive, not a quality score.
Wheel Slip / Traction Loss
Wheel speed deviations from the four-wheel average — wheelspin or lockups. Peak slip above ~10% is highlighted.
Lap scope
Select a stint or manual range on Laps to recalculate these metrics for those laps only.
Inspector charts are not scoped — they always follow Base / Compare lap pickers.
Workflows
| Goal | Steps |
|---|---|
| Rear tyre fade mid-stint | Scope stint → Driver → Wheel Slip + Strategy → Wear charts |
| Inconsistent sector times | Driver → Trail Braking + Strategy → Consistency |
| Setup bottoming | Chassis → Ride Height warning + Open Suspension charts (FRH/RRH vs distance) |
| Exit oversteer | Driver → Throttle lifts + Oversteer % on same laps |
| Shift / Vmax check | Chassis → Open Vmax / shift charts (RPM + speed + long G) |