



The Strategy view is the strategy hub for the active lap scope (all laps, a stint, or a manual range set on Stint analysis). It answers one job: can you finish — resources, degradation, and conditions.
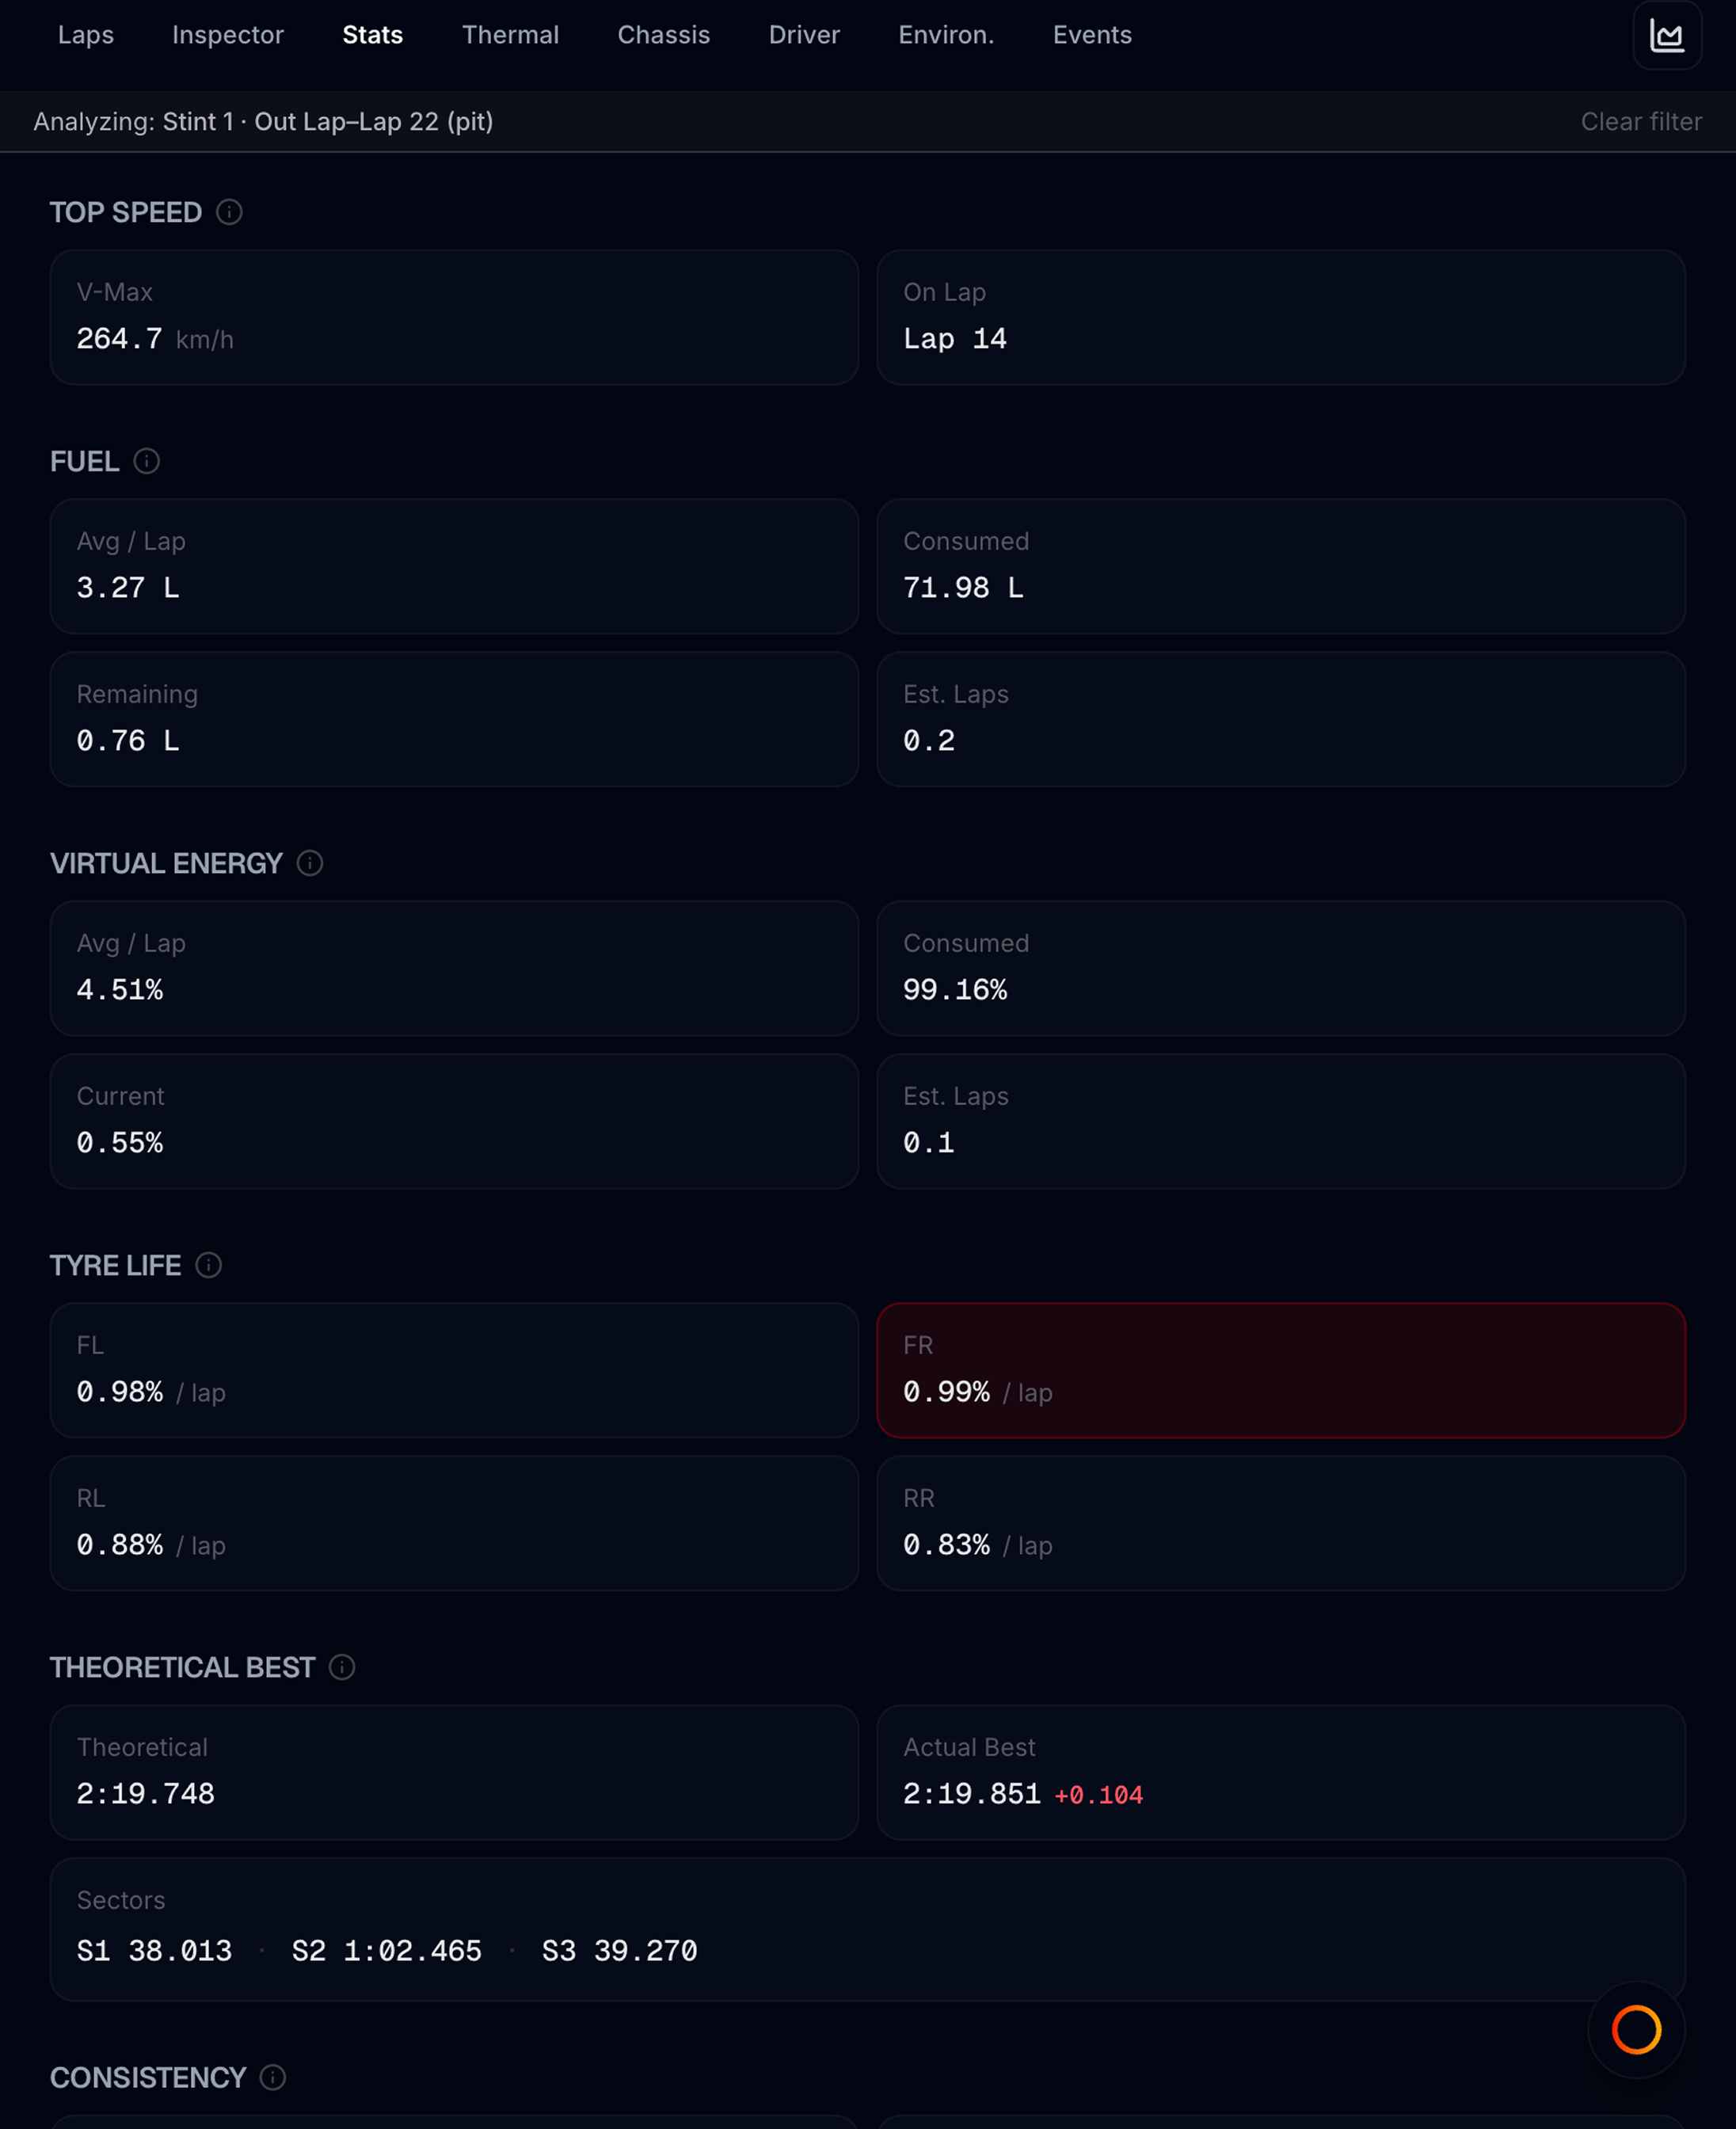
Open Pit Wall → Strategy tab.
When a stint or manual range is active, a banner at the top shows the scope (e.g. Stint 2 · Lap 8–Lap 14) with Clear filter. Click Clear filter or return to Laps → All to reset.
Sections appear only when your recording includes the needed data.
While this tab is open, the track map colours the lap by fuel use, with chips for Tyre wear and Track temp — the spatial companion to Resources and Degradation, showing where on the circuit the fuel and rubber go. The coloured lap follows the lap you hover in a chart.
Overlay
When primary scope is a stint or Manual range on Laps, use Overlay on Strategy, Thermal, Driver, or Chassis to compare a second run (hidden on Inspector, Laps, and Events). Overlay is cross-tab: the same compare target applies whether you are on Strategy, Thermal, Driver, Chassis, or Compose.
| Option | Use when |
|---|---|
| None | No compare |
| Stint N | Auto-detected stint (happy path) |
| Custom… | Auto boundaries are off, or you need an arbitrary start–end — pick Start / End laps |
Snapshot cards (Strategy) and Driver summary cards show muted overlay values under the primary scope. Driver per-lap tables and chart overlays align by stint lap age (gaps when a lap is skipped). Charts that support compare (Resources, Degradation, Conditions, Thermal trends, Chassis aero lines, Thermal Setup pressure/balance/recovery, Damper, Shift Discipline) plot dashed overlay series or muted dual values. Ride Height shows side-by-side histograms. Solid / primary = current scope · Muted / dashed = overlay. The control is hidden when scope is All. Custom Start / End options are flying laps only (no out lap or unfinished trailing last lap). Short flying-only scopes (including a single flying lap) still analyze those laps — they never silently fall back to the full session.
Vmax / shift check (Chassis) stays Base-scope only — Overlay does not apply to the distance preview.
Snapshot
Key cards for the active scope. With an overlay selected, each metric also shows the overlay value in muted text.
Top Speed
| Field | Meaning |
|---|---|
| V-Max | Peak speed reached in the active scope |
| On Lap | Which lap that peak occurred on |
Fuel
Summarizes fuel use on driving laps in scope. Pit refuel laps are excluded from averages.
| Field | Meaning |
|---|---|
| Avg / Lap | Litres consumed per driving lap on average |
| Consumed | Total litres used in scope |
| Remaining | Tank level at the end of the scoped laps |
| Est. Laps | Rough laps left at the current burn rate |
Virtual Energy
Same layout as Fuel for hybrid systems when logged.
Tyre Life
Average wear rate per lap for each corner. The limiting corner is highlighted.
Cross-check with Tyre Wear vs Lap under Degradation and Thermal for heat context.
Theoretical Best
Combines the best sector times from different laps into one theoretical lap, then compares it to your actual best.
Consistency
Lap and sector time standard deviation — the sector with the highest variation is flagged.
Resources
When Fuel Level and/or Virtual Energy channels exist:
| Chart | What it shows |
|---|---|
| Fuel Level vs Lap | Tank level at the end of each flying lap |
| Fuel Used / Lap | Litres burned per flying lap (refuel laps omitted) |
| Virtual Energy vs Lap | Charge at the end of each flying lap |
| Virtual Energy Used / Lap | Energy used per flying lap (recharge laps omitted) |
Degradation
| Chart | What it shows |
|---|---|
| Tyre Wear vs Lap | Remaining wear % per corner; limiting corner called out |
| Pace vs Limiting Wear | Lap time and limiting-corner wear on twin axes — look for the cliff |
| Wear per Fuel Consumed | ΔWear / ΔFuel per lap — rising means more tyre-hungry as fuel burns off |
| Wear per Virtual Energy | ΔWear / ΔVE per lap when both tyre wear and VE are logged |
Conditions
| Chart | Meaning |
|---|---|
| Session Conditions | Per-lap track / ambient / wind averages in scope |
| Track Evolution vs Pace | Track temp and V-Max vs lap in scope |
| Wind Sensitivity | Wind vs straight-line speed on high-speed sections |
Workflows
| Goal | Steps |
|---|---|
| Spot wear cliff timing | Scope stint → Tyre Wear vs Lap + Pace vs Limiting Wear |
| Compare two stints | Scope Stint 1 → Overlay on Strategy/Thermal/Driver/Chassis → Stint 2 (or Custom…) |
| Fuel / energy check | Scope each stint → Snapshot Fuel/VE cards + Resources charts |
| Weather vs pace | Scope stint → Session Conditions, then Track Evolution vs Pace |
Related
- Stint analysis — how to set lap scope
- Thermal — pressure, tread, brake disc temps
- Chassis and driver
- Pit Wall overview