



The track map panel is the left side of Pit Wall on desktop. It shows a 2D track map built from GPS data, which laps are loaded, and quick ways to focus a sector. The map stays visible while you switch charts-panel tabs — what it highlights follows the active view. Everything here still drives the Inspector compare lines and hover markers unless you hide the map in Full charts mode.
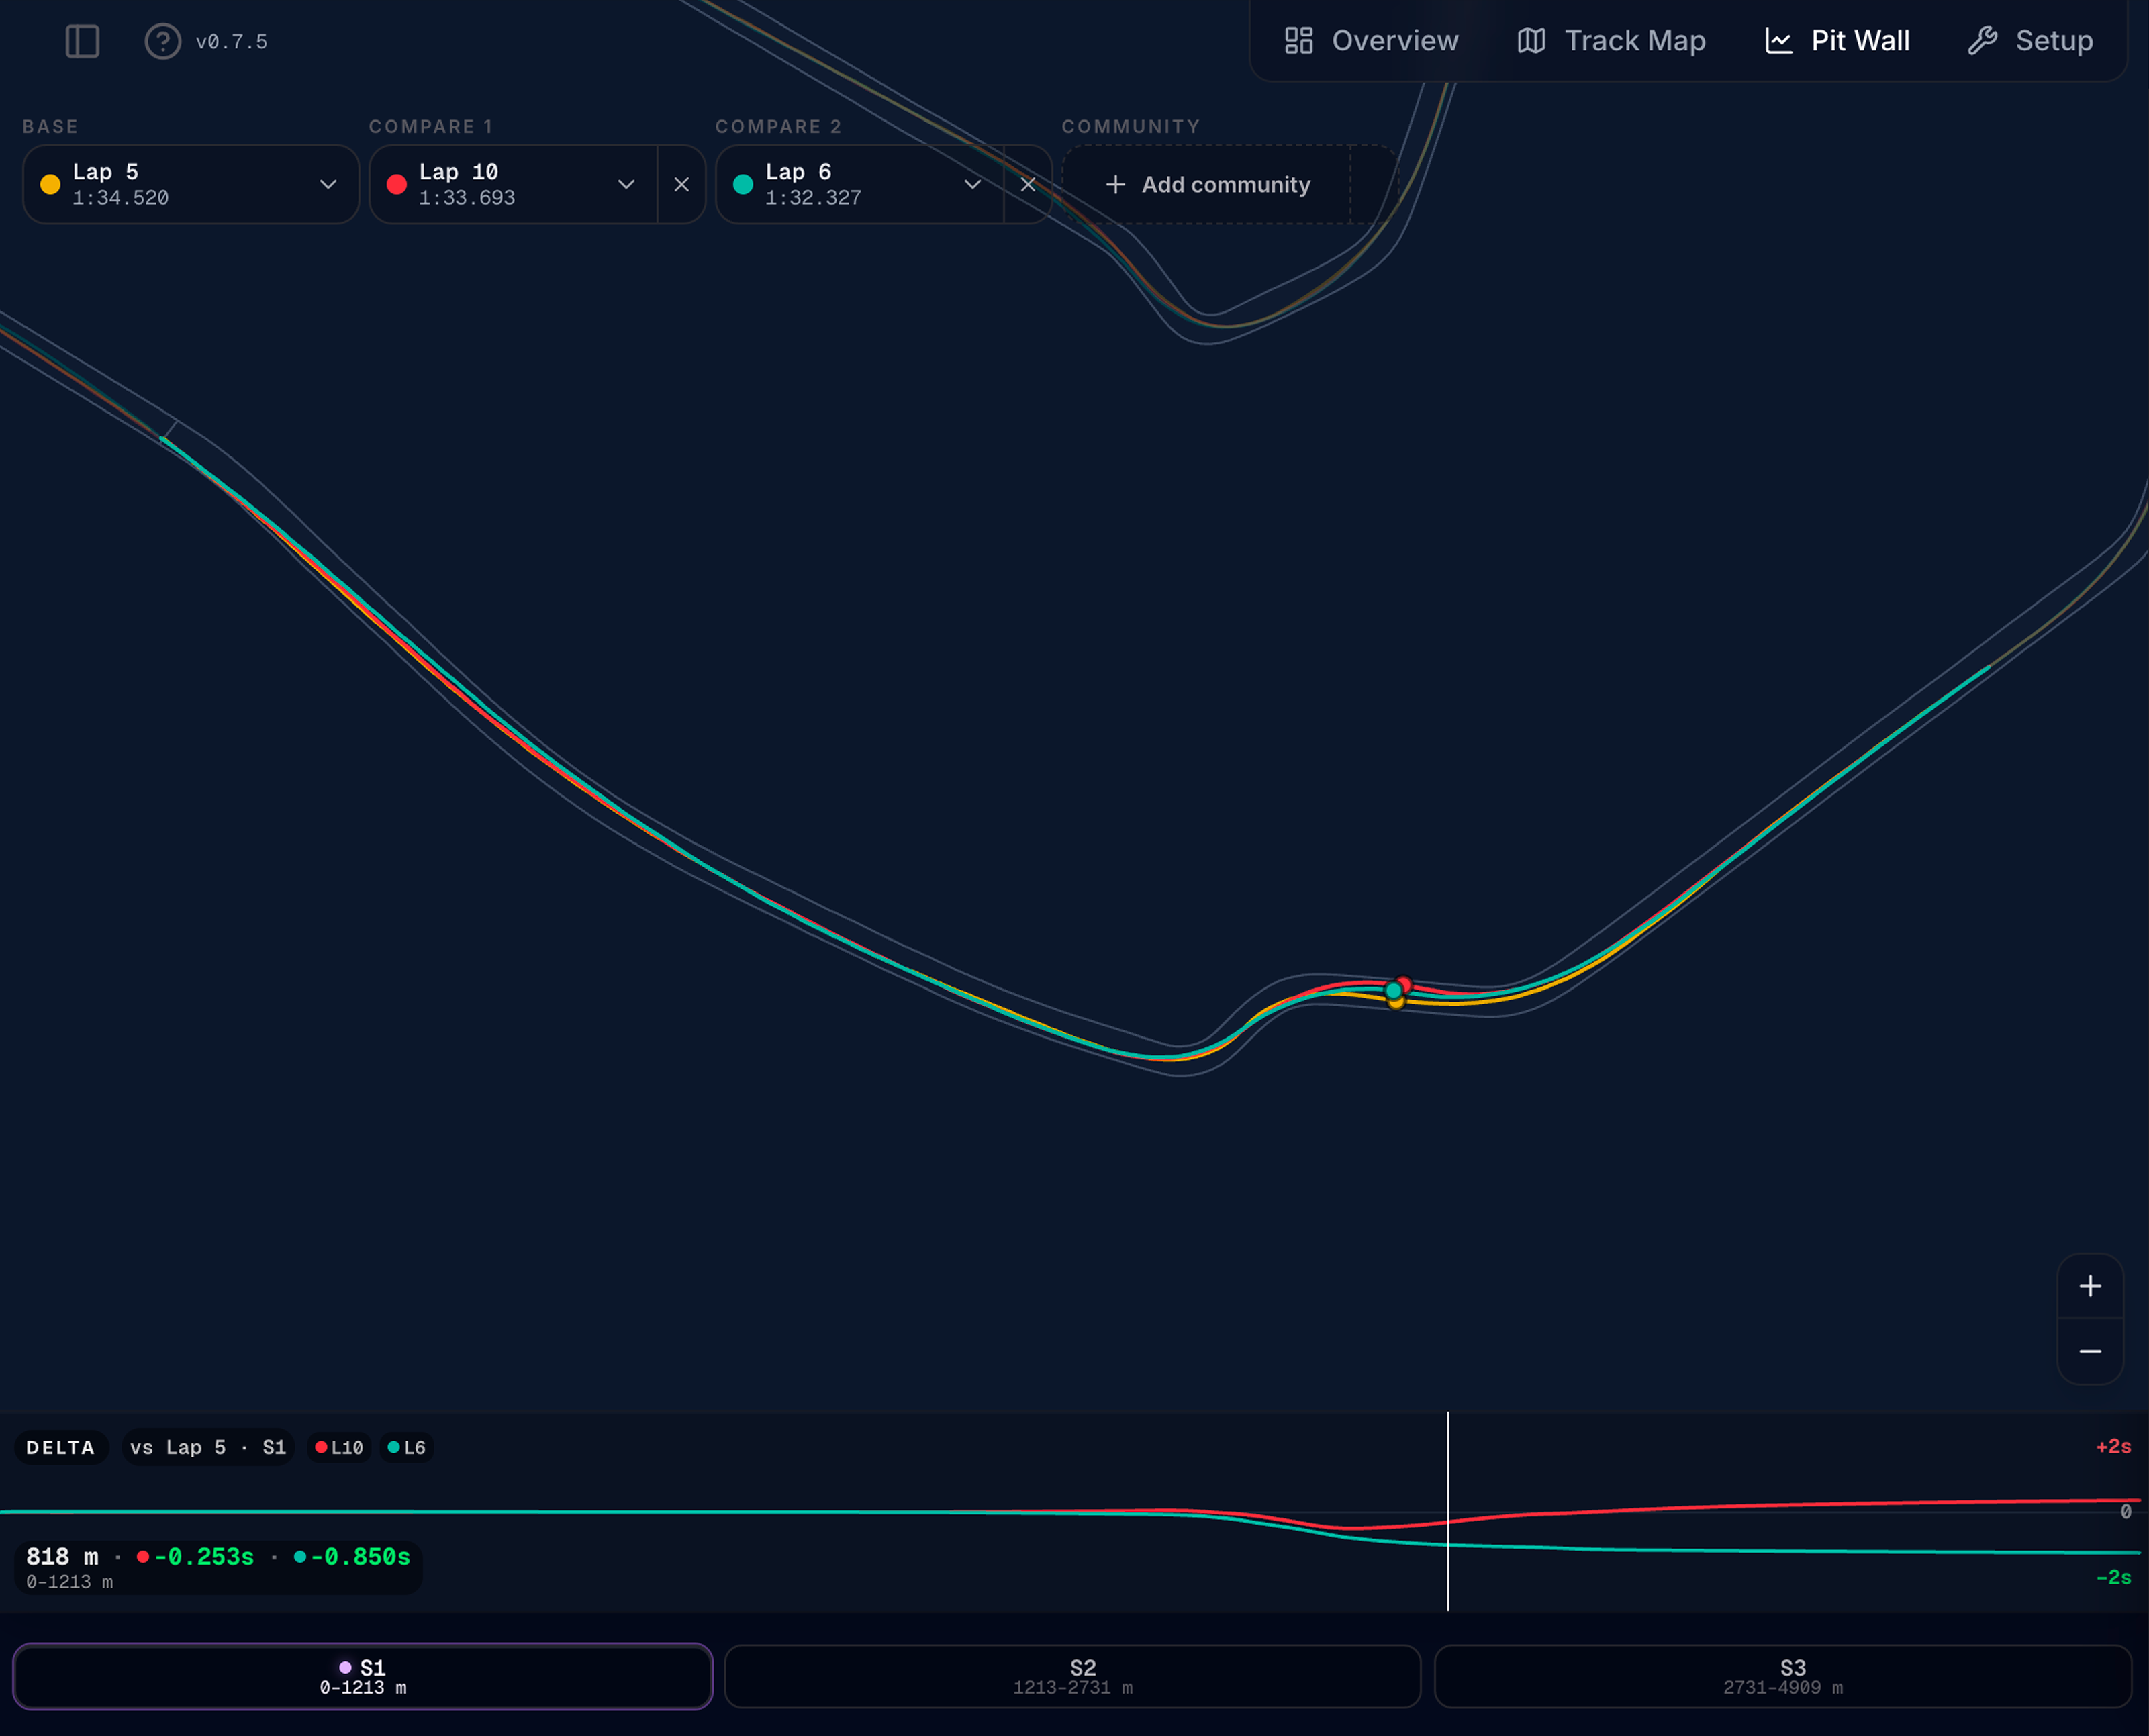
On narrow screens the map is hidden and charts use full width — lap pickers move to the Inspector toolbar.
What you see
| Element | What it does |
|---|---|
| Track outline | Circuit surface from GPS — grey fill with track edges |
| Racing lines | Path per loaded lap; community lap uses a dashed style |
| Spatial heat | On Strategy / Thermal / Driver / Chassis / Compose, colours the Base (or hovered) lap by fuel use, tyre wear, temperatures, platform metrics, or driver inputs when those modes apply. Mode chips + legend sit in the strip under the map (replacing the delta strip when chips are present) |
| Position dots | Coloured dots on each line — follow Lap Dist chart hover (Inspector, Events lap strip, Chassis Vmax) |
| Event ticks | On Events, small coloured ticks on the focused lap’s line for filtered events |
| Sector / scope highlight | On Laps, hover a sector cell or scoped row to brighten that span or lap |
| Delta strip | Time gained/lost vs base lap along the lap (when comparing) |
| Lap pickers | Overlaid at top — Base, Compare 1, Compare 2, Community |
| Focus bar | Footer — one segmented control: Full lap · S1 · S2 · S3, with the active (or hovered) span’s distance range read out underneath |
If GPS data is missing, the map shows Track map unavailable with a short explanation and Try load channels — your file may need GPS Latitude, GPS Longitude, and Lap Dist logged.
How the map follows each tab
| Charts tab | Map reaction |
|---|---|
| Inspector | Position dots and delta cursor follow channel-chart hover; the distance brush / corner preset zooms the map to that span |
| Laps | Hover a timing row to emphasize that lap’s line (drawn temporarily if it is not already Base/Compare). Hover S1 / S2 / S3 cells to highlight that sector on the map |
| Strategy | Colours the Base racing line by fuel use along the lap (where the car is sipping vs burning). Chips for Tyre wear (hotspots where wear is steepest, next to Degradation) and Track temp. Hover a chart point to switch the map + Showing Lap label to that lap |
| Thermal | Colours the Base line by carcass temp, with chips for Rubber temp and Brake temp — the heat side of the tyre. Wear rate lives on Strategy, matching where the wear charts are. Hover a chart point to switch the map + Showing Lap label to that lap |
| Driver | Colours the Base line by driver inputs — red where the brake is down, green on throttle, grey while coasting (same language as the main replay map). Hovering a per-lap table row (Trail Braking, Coasting, Throttle Application, …) switches the map + Showing Lap N to that lap |
| Chassis | Colours the line by ride height — where the platform runs lowest. Chips for Damper speed (kerb and bump strikes) and Rake. The coloured lap follows the Vmax preview lap; hovering the distance chart moves position dots, and lap-axis hover switches the map + Showing Lap N |
| Events | Event ticks for the focused lap; scrubbing the driver lap strip moves position dots without leaving Events |
| Compose | Map colouring follows metrics in your cards (e.g. Fuel Level → fuel use; Tyre Wear → wear rate; Trail Braking → driver inputs). Chips only for modes those cards imply. Hover a chart point to switch the map + Showing Lap label |
Spatial heat (Strategy / Thermal / Driver / Chassis / Compose)
Continuous modes use green → yellow → red relative to that lap (not a fixed absolute scale). Driver inputs is categorical — red / green / grey swatches instead of a low–high ramp:
| Mode | What red means (or categorical meaning) |
|---|---|
| Fuel use | Highest local fuel burn rate along the lap |
| Tyre wear | Highest local wear rate (avg of corners) — Strategy |
| Carcass temp | Hottest carcass (avg of corners) |
| Rubber temp | Hottest surface rubber (avg of corners) — Thermal |
| Track temp | Hotter track surface |
| Brake temp | Hotter discs |
| Ride height | Platform at its lowest — whichever axle is closer to the ground. Read it next to the Ride Height Distribution histogram to see where the low samples happen |
| Damper speed | Fastest shaft speed in that stretch (peak of the four corners) — kerbs, bumps, and hard kerb strikes |
| Rake | Most rake, i.e. rear high relative to the front (green = flattest) |
| Driver inputs | Red = braking · Green = throttle · Grey = coasting (both pedals off). Not a low–high scale |
Hovering a lap-index chart or per-lap table on Strategy, Thermal, Driver, Chassis, or Compose switches the map heat and the Showing Lap N label to that lap.
A chip only appears when its channel is in your export. Chassis modes need FrontRideHeight / RearRideHeight (ride height, rake) and Susp Pos (damper speed); Driver inputs need Throttle Pos and Brake Pos. Without those channels the delta strip stays.
Compose only offers chips for modes implied by the metrics in your slots (first matching metric in card order is the default) — an Aero Rake card brings the rake map; a Trail Braking or Coasting card brings driver inputs. Cards with only lap time leave the delta strip.
When more than one mode is available, the chips form one segmented control in the strip under the map. With a single mode the chip row is hidden and the legend names the colouring directly.
The legend always reads out values, not just colours:
| Mode type | Legend |
|---|---|
| Continuous (fuel, wear, temps, platform) | Green → red gradient plus the two ends of the scale in real units for the selected lap — e.g. 0.42 → 2.10 L/km, 86 → 141 °C, or 55 → 22 mm for ride height (green end first). Rate modes read per km; ride height reads actual clearance, so the number falls as the colour heats up |
| Categorical (Driver inputs) | A bar split by how much of the lap sits in each state, plus the share next to each colour — e.g. Brake 18% · Throttle 61% · Coast 21% |
A Showing Lap N label and a one-line reading hint sit beneath.
Channels load with the tab (same as the charts). If a continuous mode has no useful variation on the selected lap, the line stays slate and the legend notes that.
Inspector / Events lap strip / Chassis Vmax still move position dots along Lap Dist. Stint-age / lap-index charts do not invent a fake track-distance cursor.
Lap pickers
| Picker | Role |
|---|---|
| Base | Primary lap — solid racing line and primary series on charts |
| Compare 1 | First overlay lap |
| Compare 2 | Second overlay lap |
| Community | Leaderboard best lap for this track (daily view limits match Track Map) |
Rules and tips
- Out laps and the final partial lap cannot be compare targets
- The same lap cannot be Base and Compare at once — disabled in the dropdown
- Community driver name appears in chart legends when loaded
- If lap distances differ a lot between picks, a warning appears — charts align only to the shortest span
Workflow: Pick your fastest valid lap as Base, add a slower lap as Compare 1, watch the delta strip to see where time is lost, then open Inspector on the matching sector.
Delta strip
Appears below the map when at least one compare lap or community lap is loaded, on tabs without spatial mode chips (Inspector, Laps, Events — and Driver / Chassis / Compose when their channels or cards do not add a mode). On Strategy / Thermal / Driver / Chassis / Compose the chips and heat legend take that row instead when modes are available.
| Reading | Meaning |
|---|---|
| Line above centre | Compare is faster at that distance |
| Line below centre | Compare is slower |
| Colour | Matches compare lap colour |
Hover on Lap Dist charts (Inspector, Events lap strip) to see the corresponding point on the strip and map dots move together. The Chassis Vmax chart still moves the map dots, but that tab shows the heat legend rather than the strip.
Sector zoom
The footer focus bar is a single segmented control: Full lap, then S1 / S2 / S3. The selected sector lights up in its map colour. The line under the bar names the current span and its lap-distance range in metres; hover a segment to preview that sector’s range without selecting it.
Click a sector to:
- Dim the full lap and highlight that sector on the map
- Match Inspector charts to the same distance range
- Enable zoom and pan on the sector view
Click Full lap (or the same sector again) to reset. Full lap in Inspector corner presets also resets sector zoom.
Hovering S1–S3 cells on the Laps timing table highlights the same sector span without changing the footer selection.
Sector zoom is a map-level control, so it stays applied on every charts tab. The Inspector distance brush / corner preset zoom belongs to Inspector charts: other tabs show the whole track, and returning to Inspector restores the zoom (including how far you had zoomed and panned).
Zoom and pan (sector active)
| Control | Action |
|---|---|
| + / − (bottom-right of the map) | Zoom in / out on the focused span — the current level (e.g. 1.25×) sits between the buttons and greys out at the limits |
| Drag on map | Pan when zoomed in |
| Cursor | Grab hand when pan is available |
Sector zoom is independent of stint scope on the Laps view.
Full charts mode
Click the chart area icon in the charts panel header to hide this map and expand charts. Lap pickers move into the Inspector toolbar. Click the map icon to restore the split layout.
Use Full charts when you need maximum chart height — e.g. five Custom channels or a long suspension stack.
Resize
Drag the vertical divider between map and charts to change panel width. Width is saved per browser for the next visit.
Related
- Inspector — charts synced to map hover and lap pickers
- Events Log — lap-strip hover and event ticks on the map
- Pit Wall overview
- Community ghost