



The Laps view is where you read lap times, spot pace trends, and choose which laps feed the summary tabs (Strategy, Thermal, Driver, Chassis, Compose, Events).
Two lap models: Scope on this tab filters summary tabs only. It does not change the Base / Compare pickers used by Inspector and the track map.
Open Pit Wall → Laps tab (second tab in the charts panel, after Inspector).
Stint & lap scope
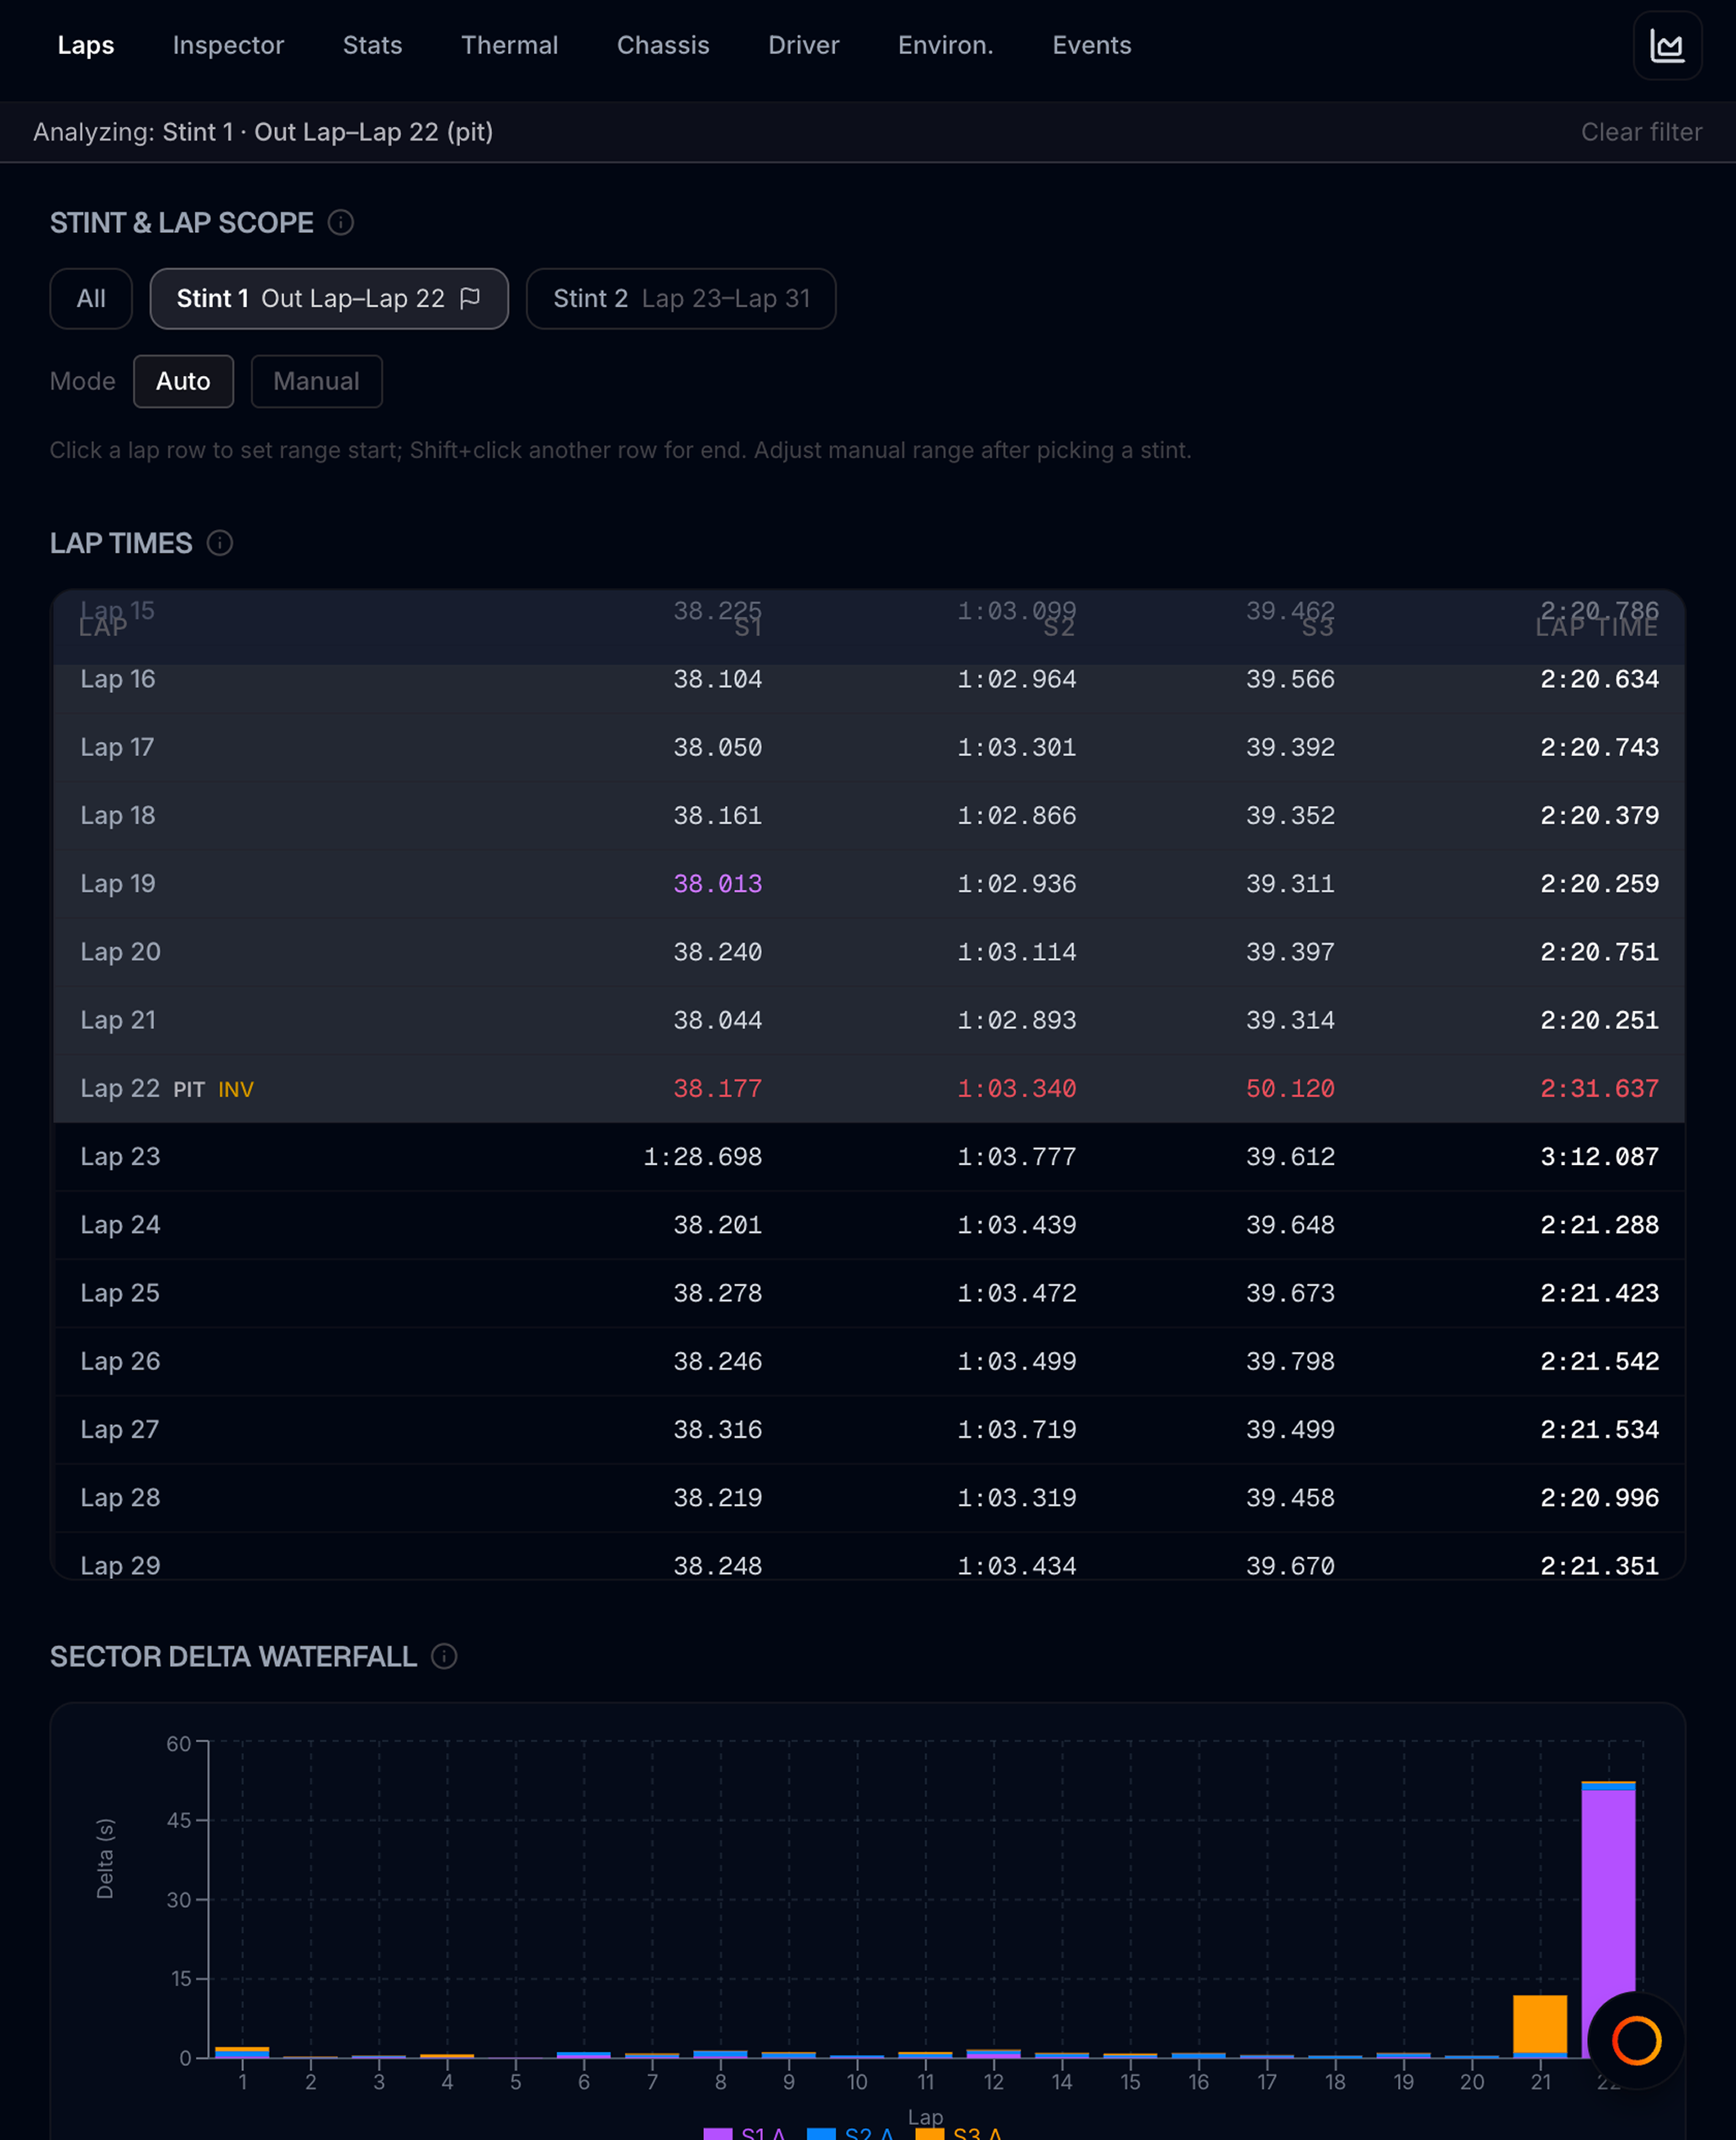
At the top of the Laps view, Stint & lap scope controls which laps the summary views analyze.
All (default)
Click All to include every lap in the session. Summary tabs show whole-session numbers.
Stint chips
MyLMU groups laps into stints automatically:
- In Pits events — primary signal; laps spent largely in the pit lane are marked pit
- Tyre compound changes — fallback when pit events are missing
- Fuel refill — second fallback from fuel level jumps
Each detected stint appears as a chip: Stint 1, Stint 2, … with the first and last lap labels (e.g. Lap 3–Lap 14). A flag icon marks stints that ended with a pit lap.
Click a stint chip to scope summary views to that run only. A banner appears on scoped tabs: Stint 2 · Lap 8–Lap 14 with Clear filter.
If no pit boundaries are found, the session is treated as a single stint.
Auto vs Manual mode
| Mode | When to use |
|---|---|
| Auto | Pick stint chips — MyLMU uses detected pit boundaries |
| Manual | Define your own lap range with the table or dropdowns |
Switch to Manual to set an exact start and end lap with the Start and End dropdowns, or by clicking rows in the table (see below). You can refine a manual range after picking a stint — useful when you only want laps 10–15 inside Stint 2.
Tip: Click All anytime to reset scope across every summary tab.
Lap timing table
The Lap Times table lists every lap with sector splits. Scroll inside the table if the session is long.
| Column | What it means |
|---|---|
| Lap | Lap number; pit laps tagged pit; invalid laps tagged inv. Out lap and trailing unfinished last lap are omitted. |
| S1 / S2 / S3 | Sector times; session-best sector in purple |
| Lap Time | Full lap; session-best in green; invalid times in red |
A last lap is treated as unfinished only when both its sample span and peak Lap Dist look incomplete versus prior flying laps — a finished-but-quick last lap stays selectable.
Invalid laps may show red sector times — they are still useful for spotting where a lap went wrong, but they are excluded from best-lap highlighting.
Selecting a manual range in the table
| Action | Result |
|---|---|
| Click a row | Sets the range start lap (Manual mode) |
| Shift+click another row | Sets the range end lap |
| Selected rows | Highlighted with a left accent bar |
The first click after switching to Manual also sets both start and end to that lap — shift+click a second lap to widen the range.
Sector Delta Waterfall
Below the table (when sector data exists), a stacked bar chart shows per-lap time gained or lost in each sector compared to the session’s best sector times.
| Bar colour | Sector |
|---|---|
| Purple | S1 delta |
| Blue | S2 delta |
| Amber | S3 delta |
Bars above the zero line mean that lap was slower than the best possible sector time; stacked height shows total lap delta. Use this to answer: Which sector cost me time on lap 12? then scope that stint and open Driver or Inspector for detail.
Hover a bar to see exact deltas per sector.
What changes when you scope
| View | Respects lap scope? |
|---|---|
| Strategy, Thermal, Driver, Chassis, Compose, Events | Yes |
| Inspector, track map pickers | No — always Base / Compare |
Scoped examples:
- Strategy → Tyre Life for Stint 1 only — compare wear rate before the first stop
- Strategy → Tyre Wear vs Lap on a stint — see when degradation accelerates
- Strategy → Wear per Fuel on a manual range — see if the car got more tyre-hungry late in a stint
- Overlay (Strategy / Thermal / Driver / Chassis) — plot Stint 2 (or a Custom start–end range) as dashed lines against scoped Stint 1 / Manual (aligned by stint lap age)
- Driver → Trail Braking on laps 5–10 — isolate one tricky sector sequence
Use cases
- Stint 1 vs Stint 2 tyre degradation — scope Stint 1, set Overlay to Stint 2 on Thermal or Strategy, or flip chips and check Tyre Life
- Find the tyre cliff — Pace vs Limiting Wear on the full stint, then open Inspector on the cliff lap
- Isolate a race segment — Manual range from lap 10–20, then open Driver braking metrics
- Find the pace drop-off lap — Sector Delta Waterfall on the full session, then narrow scope to that stint
- Audit pit strategy — look for pit tags in the table and flag icons on stint chips