



The Thermal view focuses on rubber and brake heat for the active lap scope from Stint analysis.
Open Pit Wall → Thermal tab.
Sections appear only when the recording includes the channels each chart needs. Tyre wear % vs lap, pace cliff, and wear-per-fuel charts live on Strategy → Degradation. Use the View preset Setup here for pressure and tread-balance detail; Heat for disc/carcass temp trends.
While this tab is open, the track map colours the lap by carcass temp, with chips for Rubber temp and Brake temp — showing where the heat builds. Wear rate sits on the Strategy map, next to the wear charts.
View presets
| Preset | Sections |
|---|---|
| Heat | Brake disc temp vs lap · Tyre temp vs lap |
| Setup | Pressure stabilization · Tyre thermal balance · Surface → carcass recovery |
| All sections | Everything above |
Overlay
When primary scope is a stint or Manual range, use Overlay (same control as Strategy / Driver / Chassis) to compare a second stint or Custom flying-lap range. Brake Disc Temp vs Lap and Tyre Temp vs Lap plot dashed overlay series aligned by stint lap age. Pressure Stabilization, Tyre Thermal Balance, and Surface → Carcass Recovery show muted Overlay values (same scope sampling as other Setup cards). Full Overlay rules: Strategy → Overlay.
Brake Disc Temp vs Lap
Peak brake disc temperature per corner each lap. Rising peaks late in a stint often mean ducts too closed or heavy braking load. With Overlay set, dashed series align by stint lap age.
Tyre Temp vs Lap
Average carcass temperature per corner (falls back to centre tread if carcass is missing). With Overlay set, dashed series align by stint lap age.
Pressure Stabilization
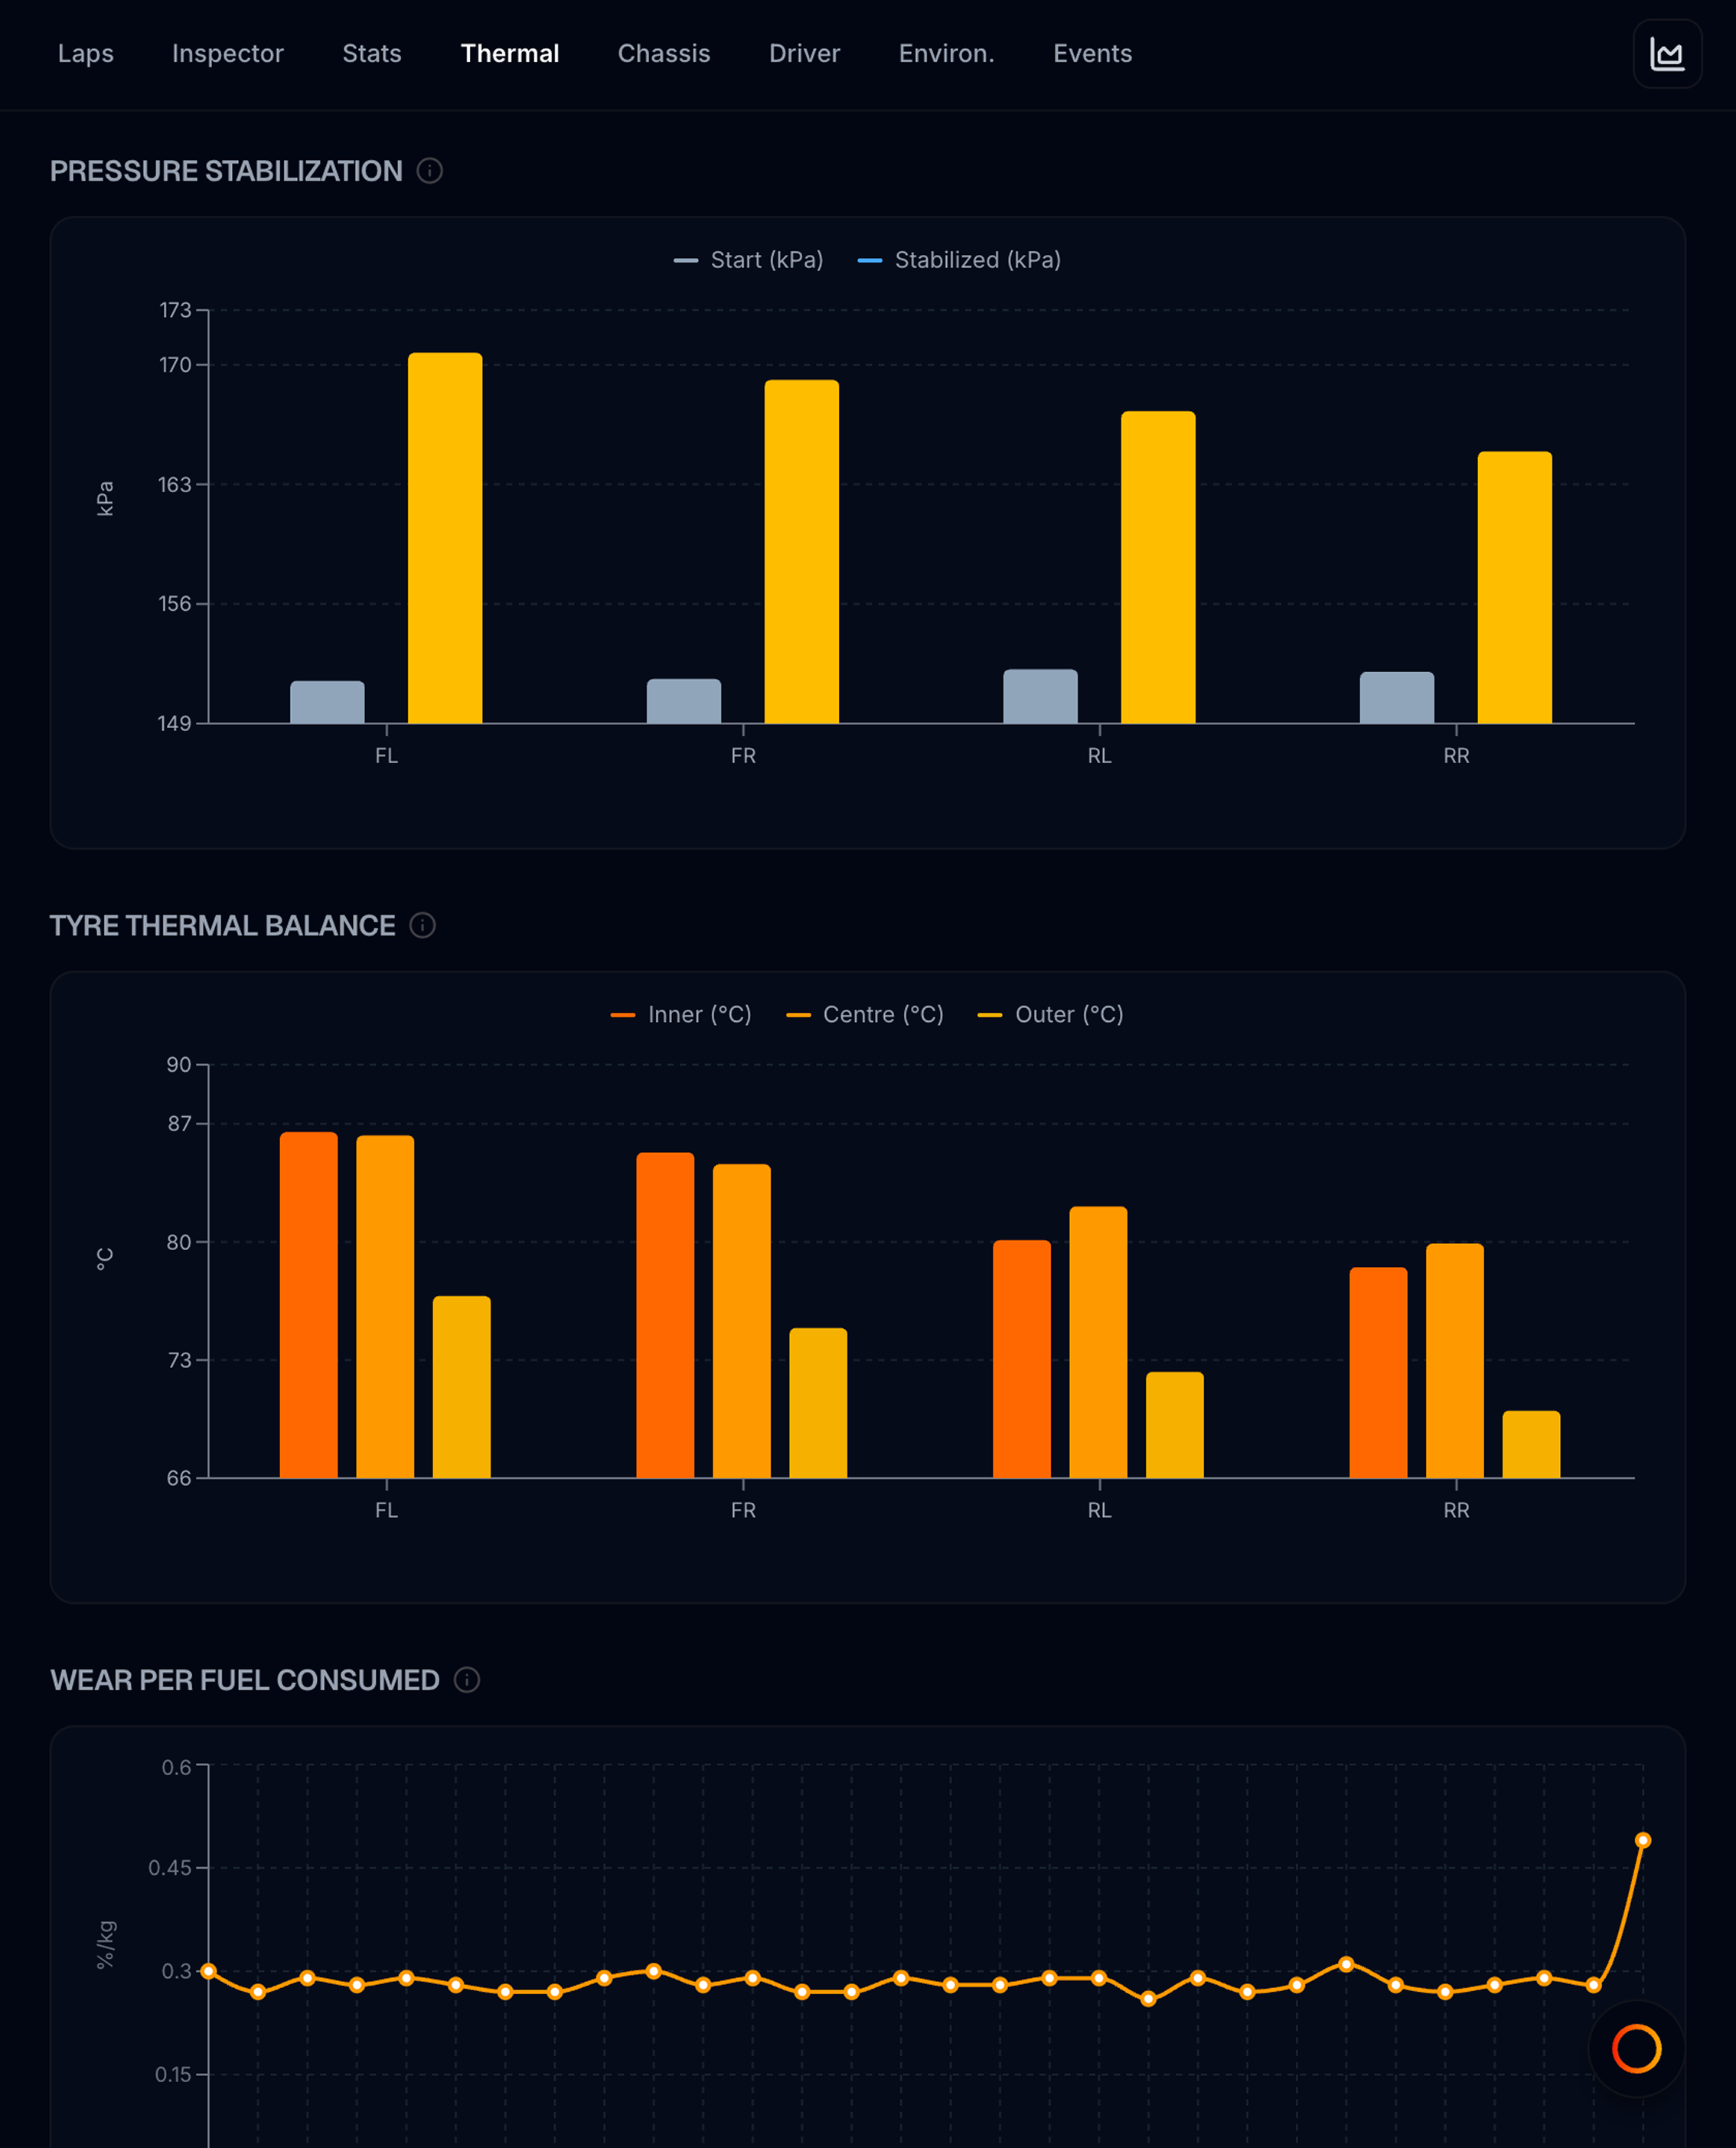
Bar chart per corner (FL, FR, RL, RR) comparing cold vs hot pressures:
| Bar | Meaning |
|---|---|
| Start (grey) | Pressure at stint beginning |
| Stabilized (blue) | Pressure after the tyre heats up |
| Stabilized (amber) | Corner that bled high |
Tyre Thermal Balance
Average inner, centre, and outer tread temperatures per corner (averaged over the current lap scope), with spread and diagnostic hints in the tooltip.
Surface → Carcass Recovery
Per corner, how far (in metres) surface temperature takes to match carcass on the longest straight in scope. Slow recovery can mean ducts too closed or scrubbing in fast corners.
Workflows
| Goal | Steps |
|---|---|
| Diagnose hot brakes | Scope stint → Brake Disc Temp vs Lap |
| Diagnose hot tyre on one corner | Pressure Stabilization + Tyre Thermal Balance |
| Check heat soak | Tyre Temp vs Lap mid-stint vs early laps |
| Compare heat between stints | Scope Stint 1 → Overlay Stint 2 → brake/tyre temp charts |
Related
- Strategy — wear, pace cliff, fuel/VE, conditions
- Chassis and driver
- Stint analysis
- Overlays and modals — live tyre overlay during Track Map replay